
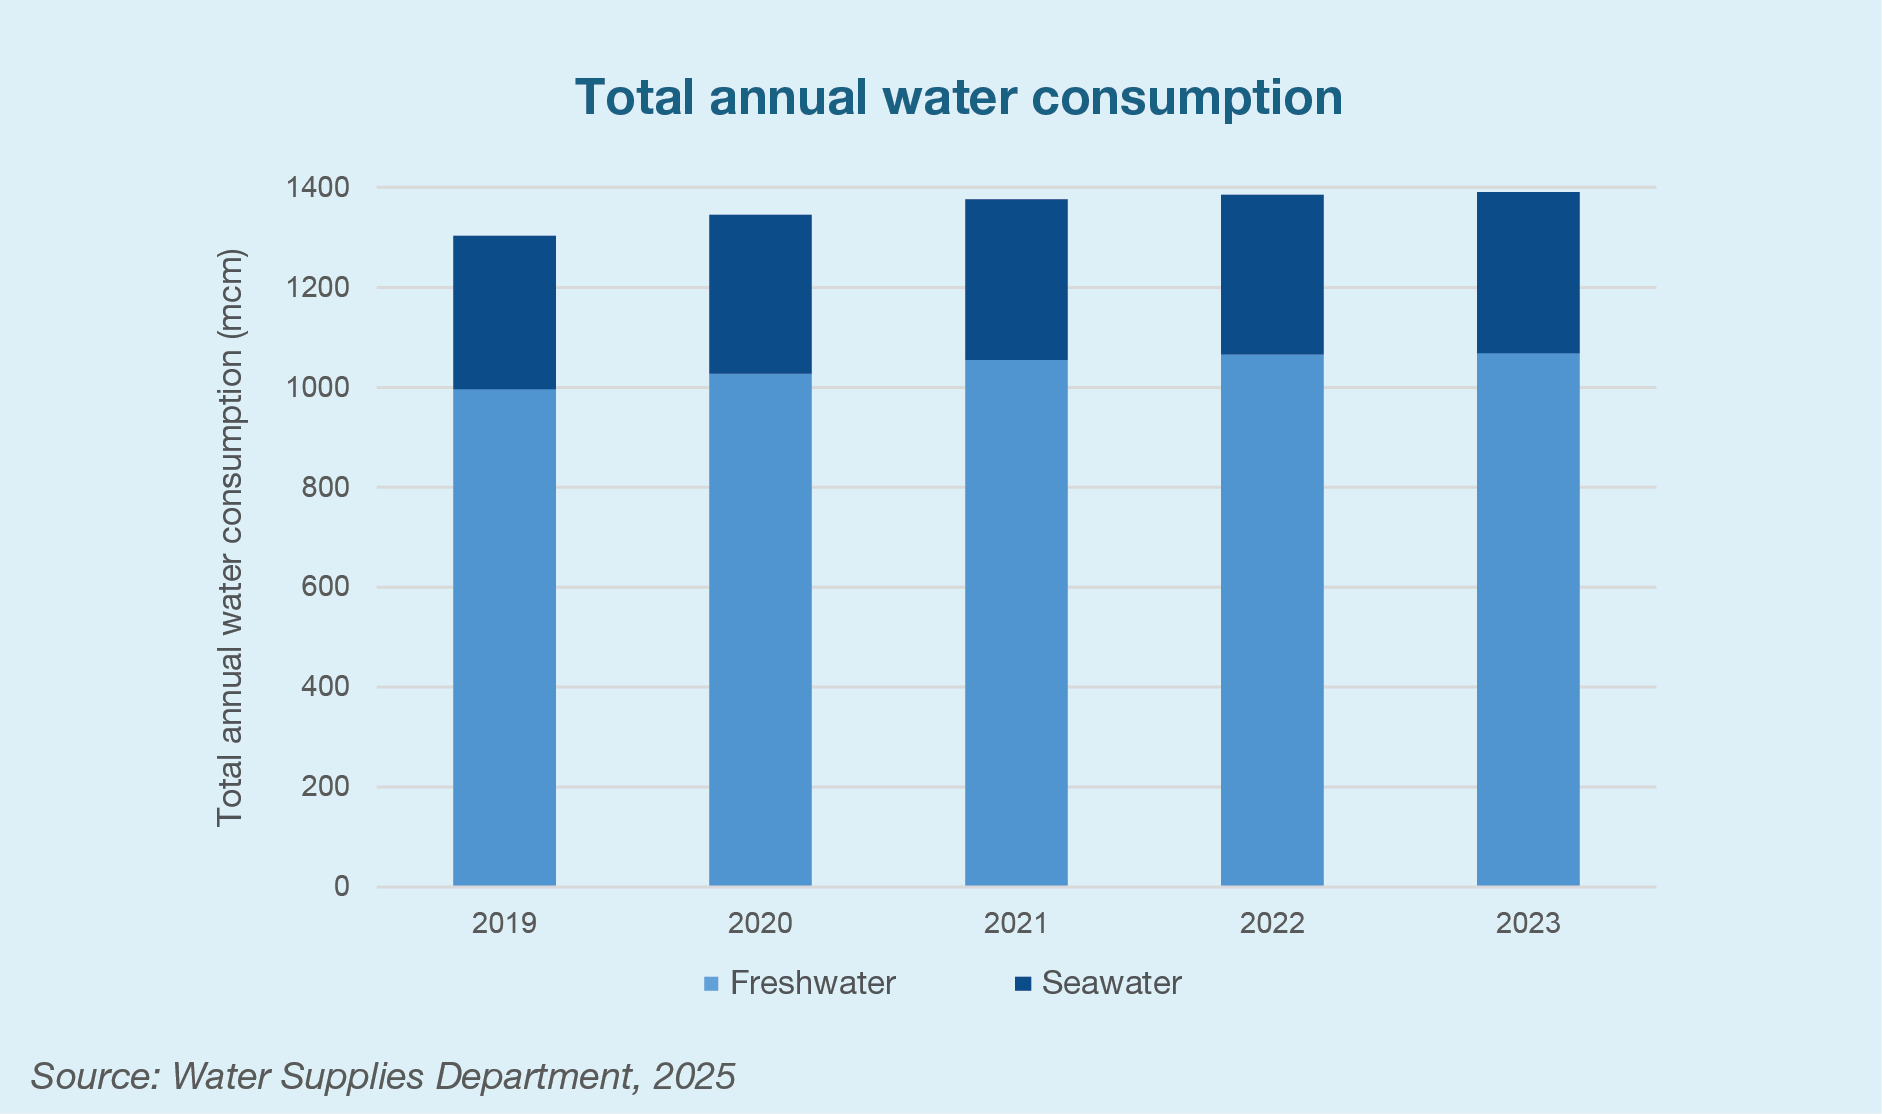
1.1 How much water does Hong Kong consume annually?
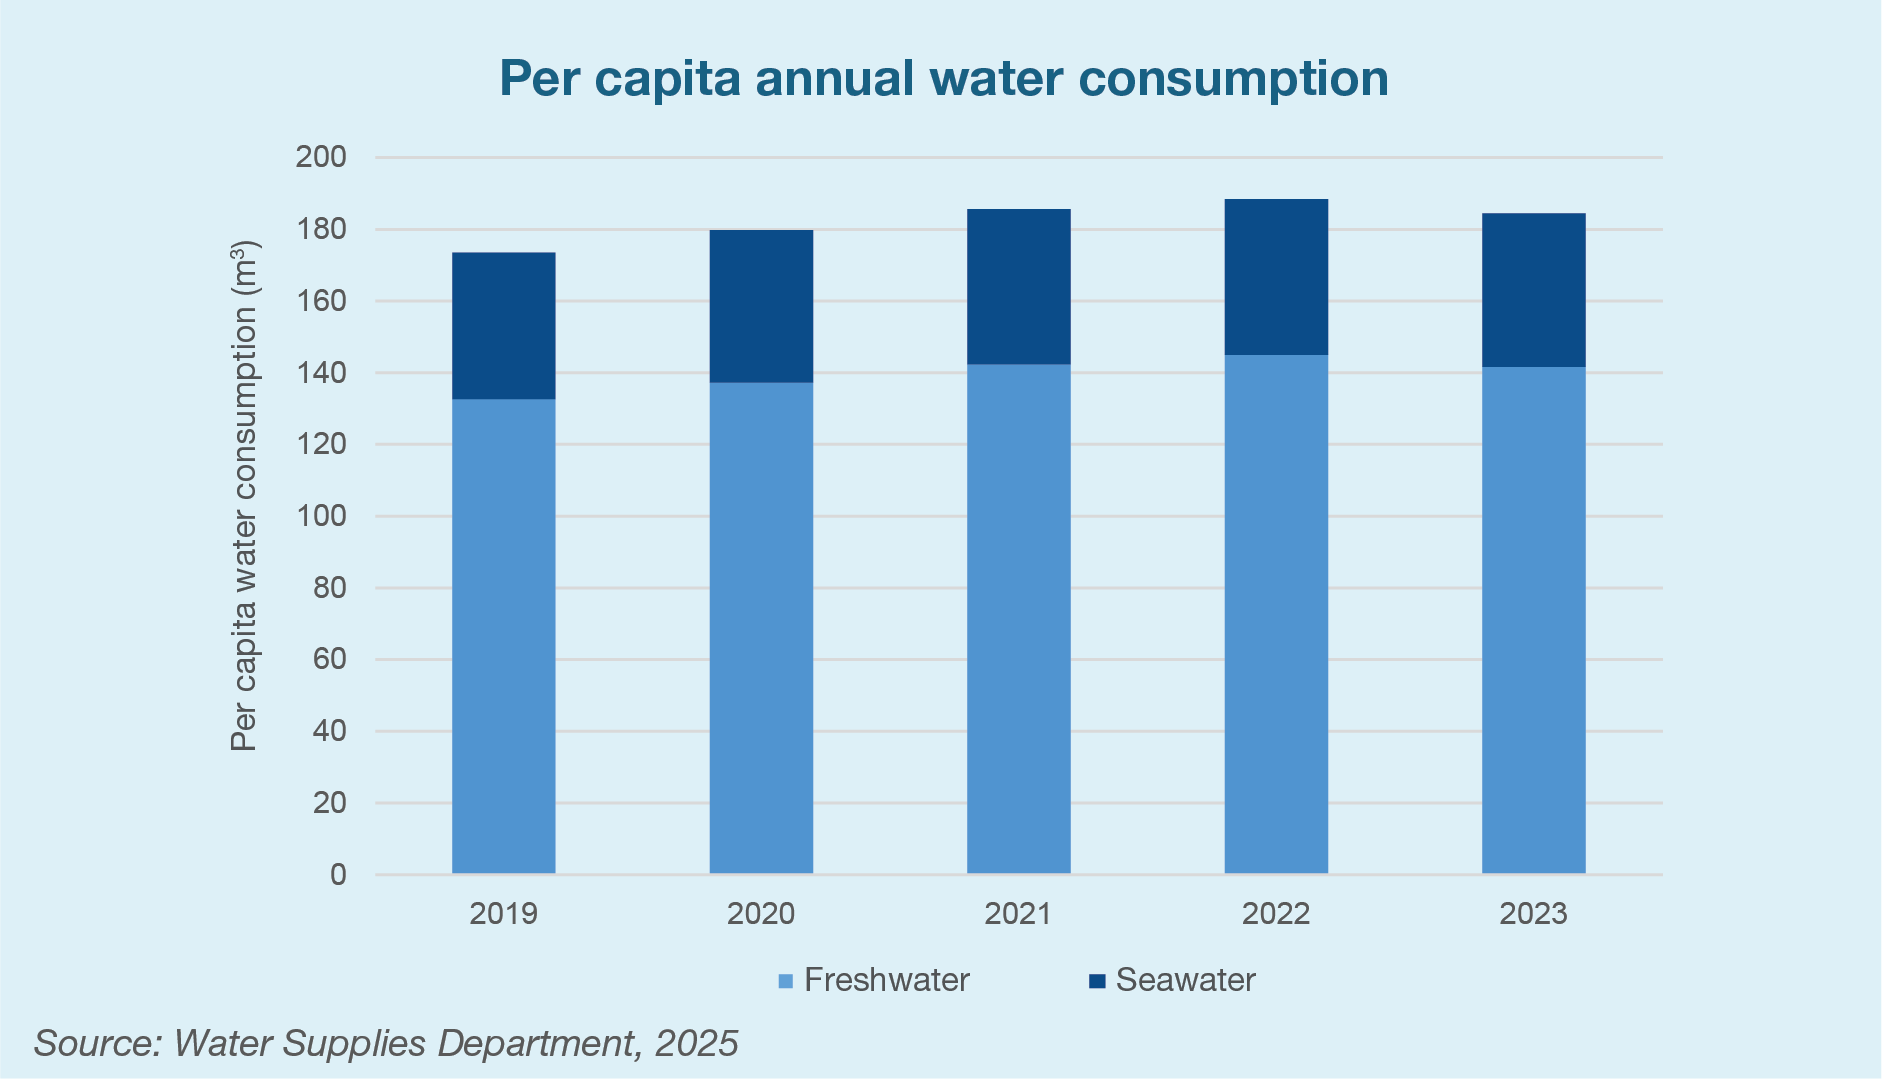
1.2 How much water does each person use, on average, in Hong Kong?
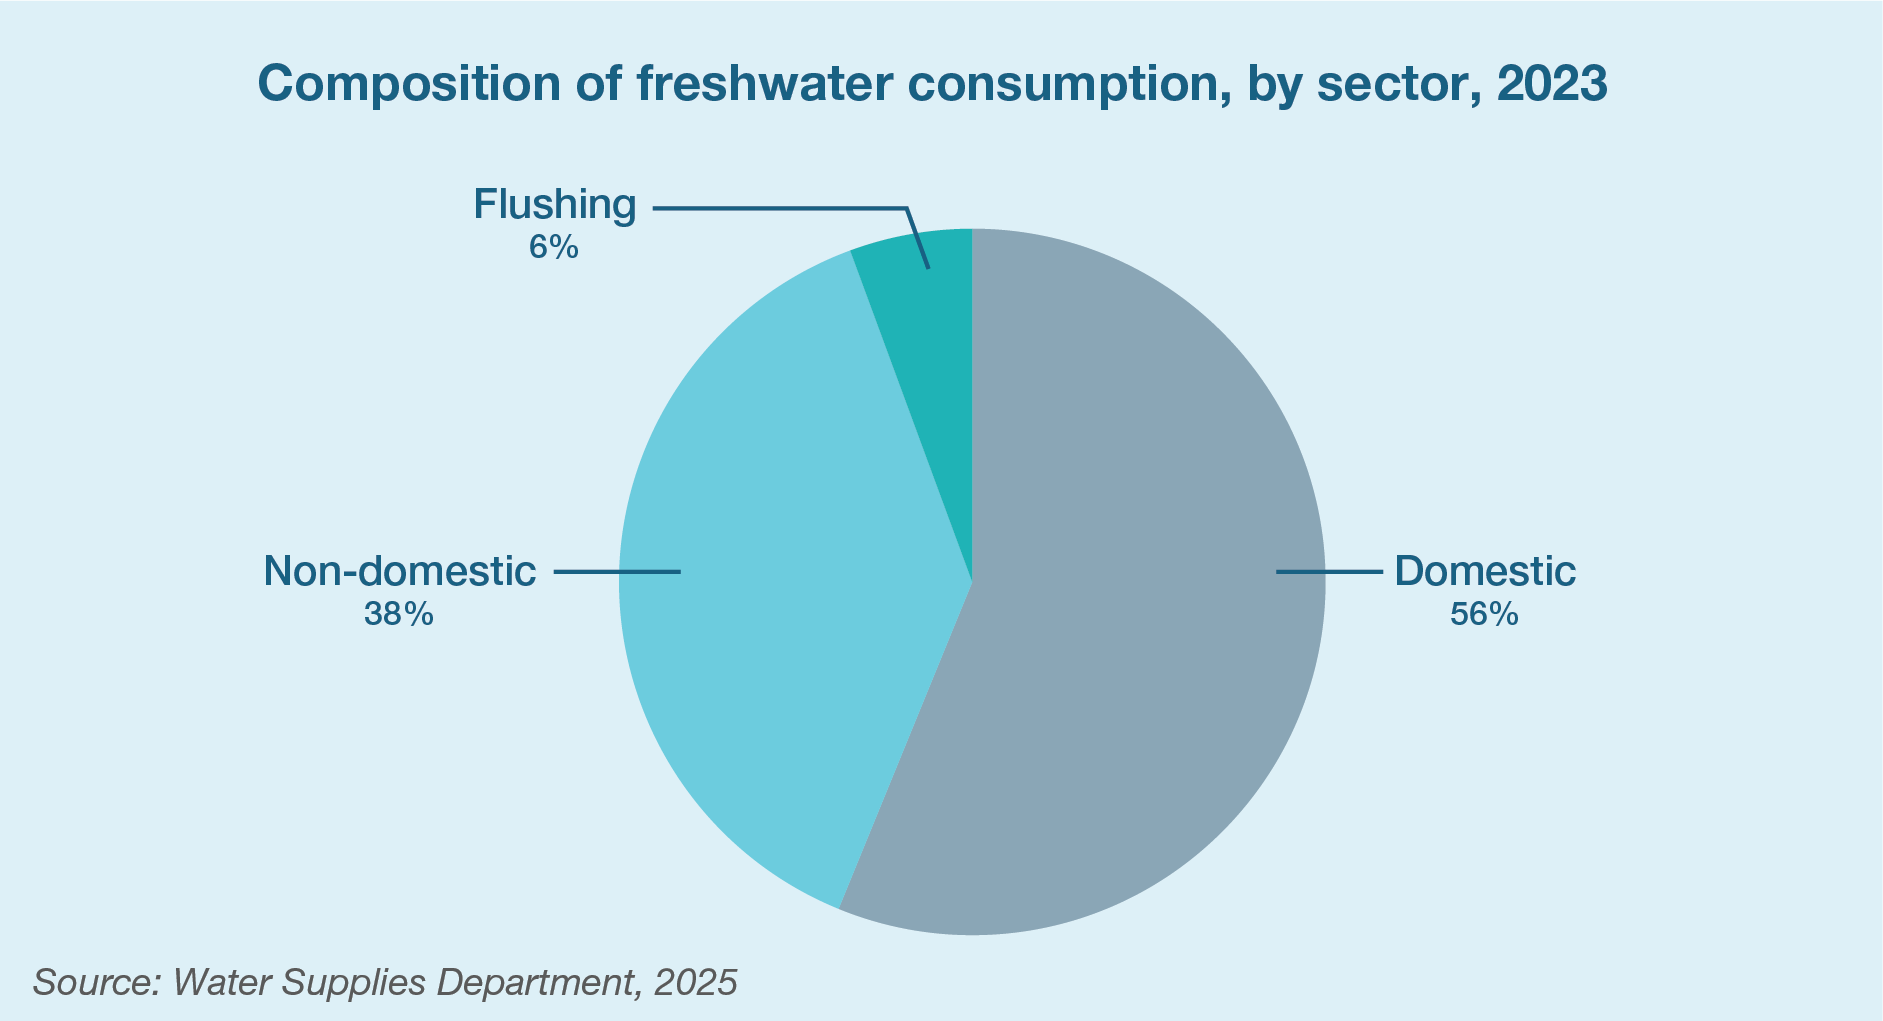
1.4 What is the composition of freshwater consumption, by sector?
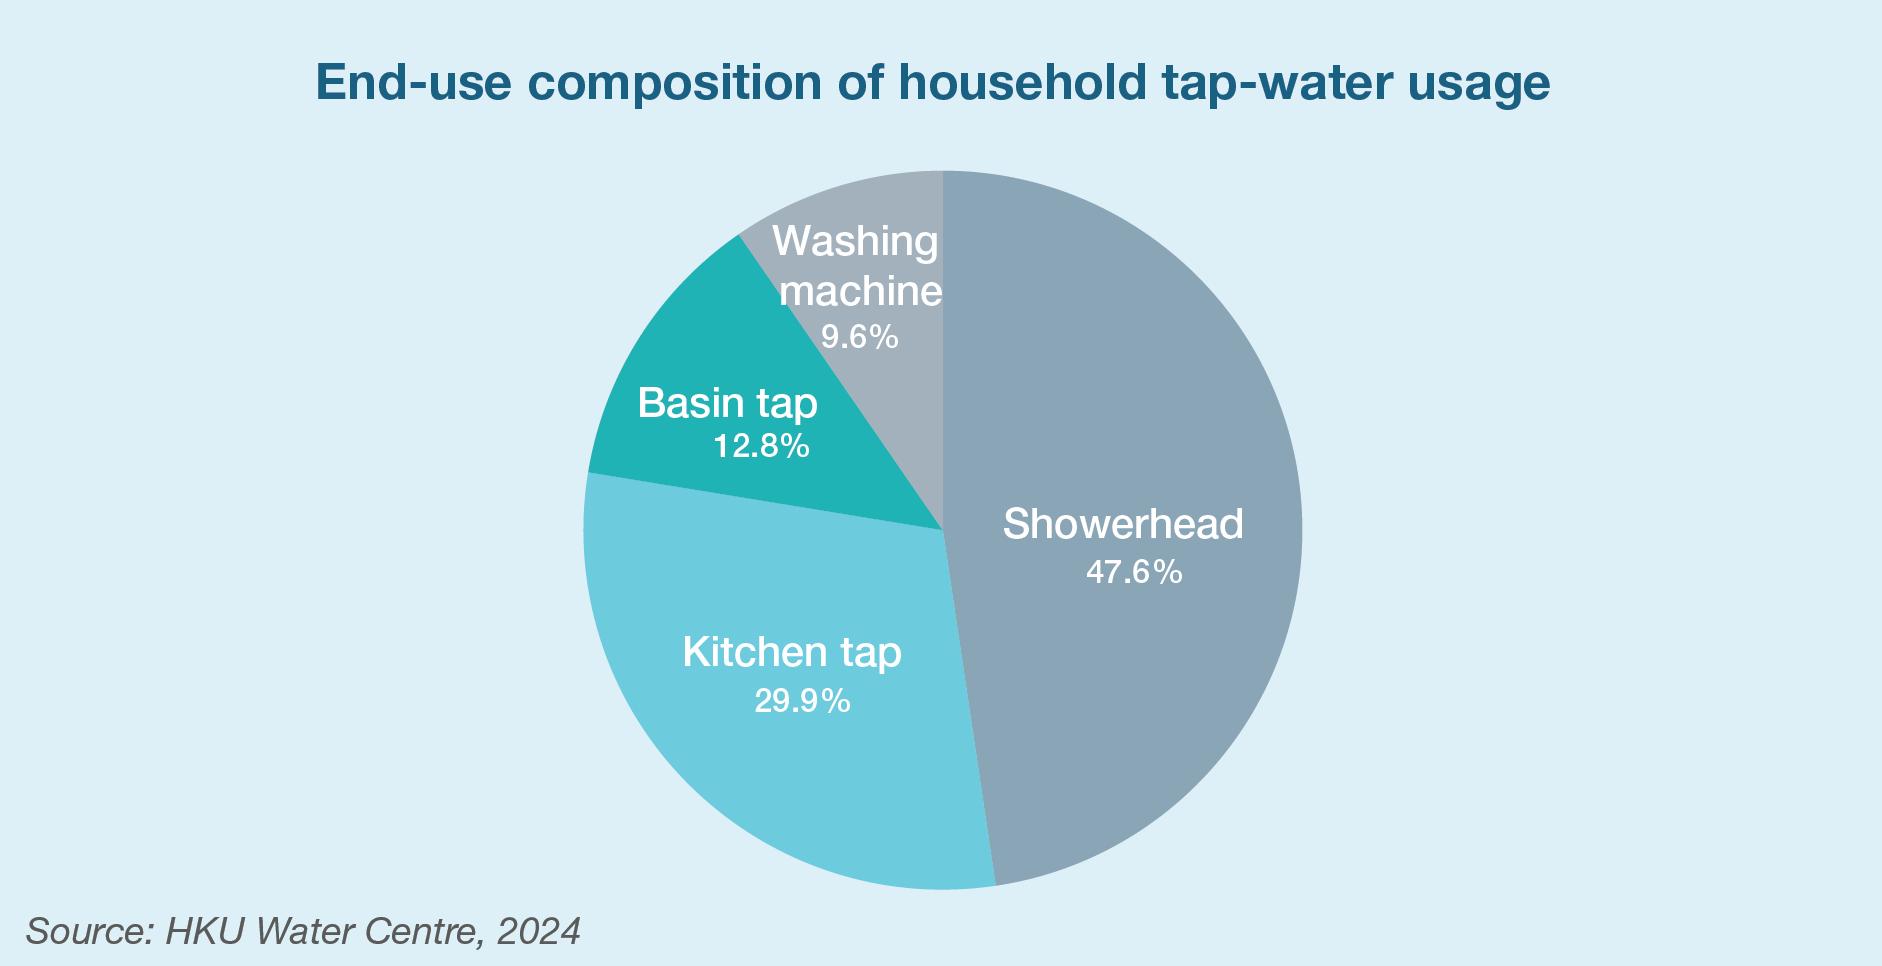
1.6 What is the end-use composition of household tap-water usage?
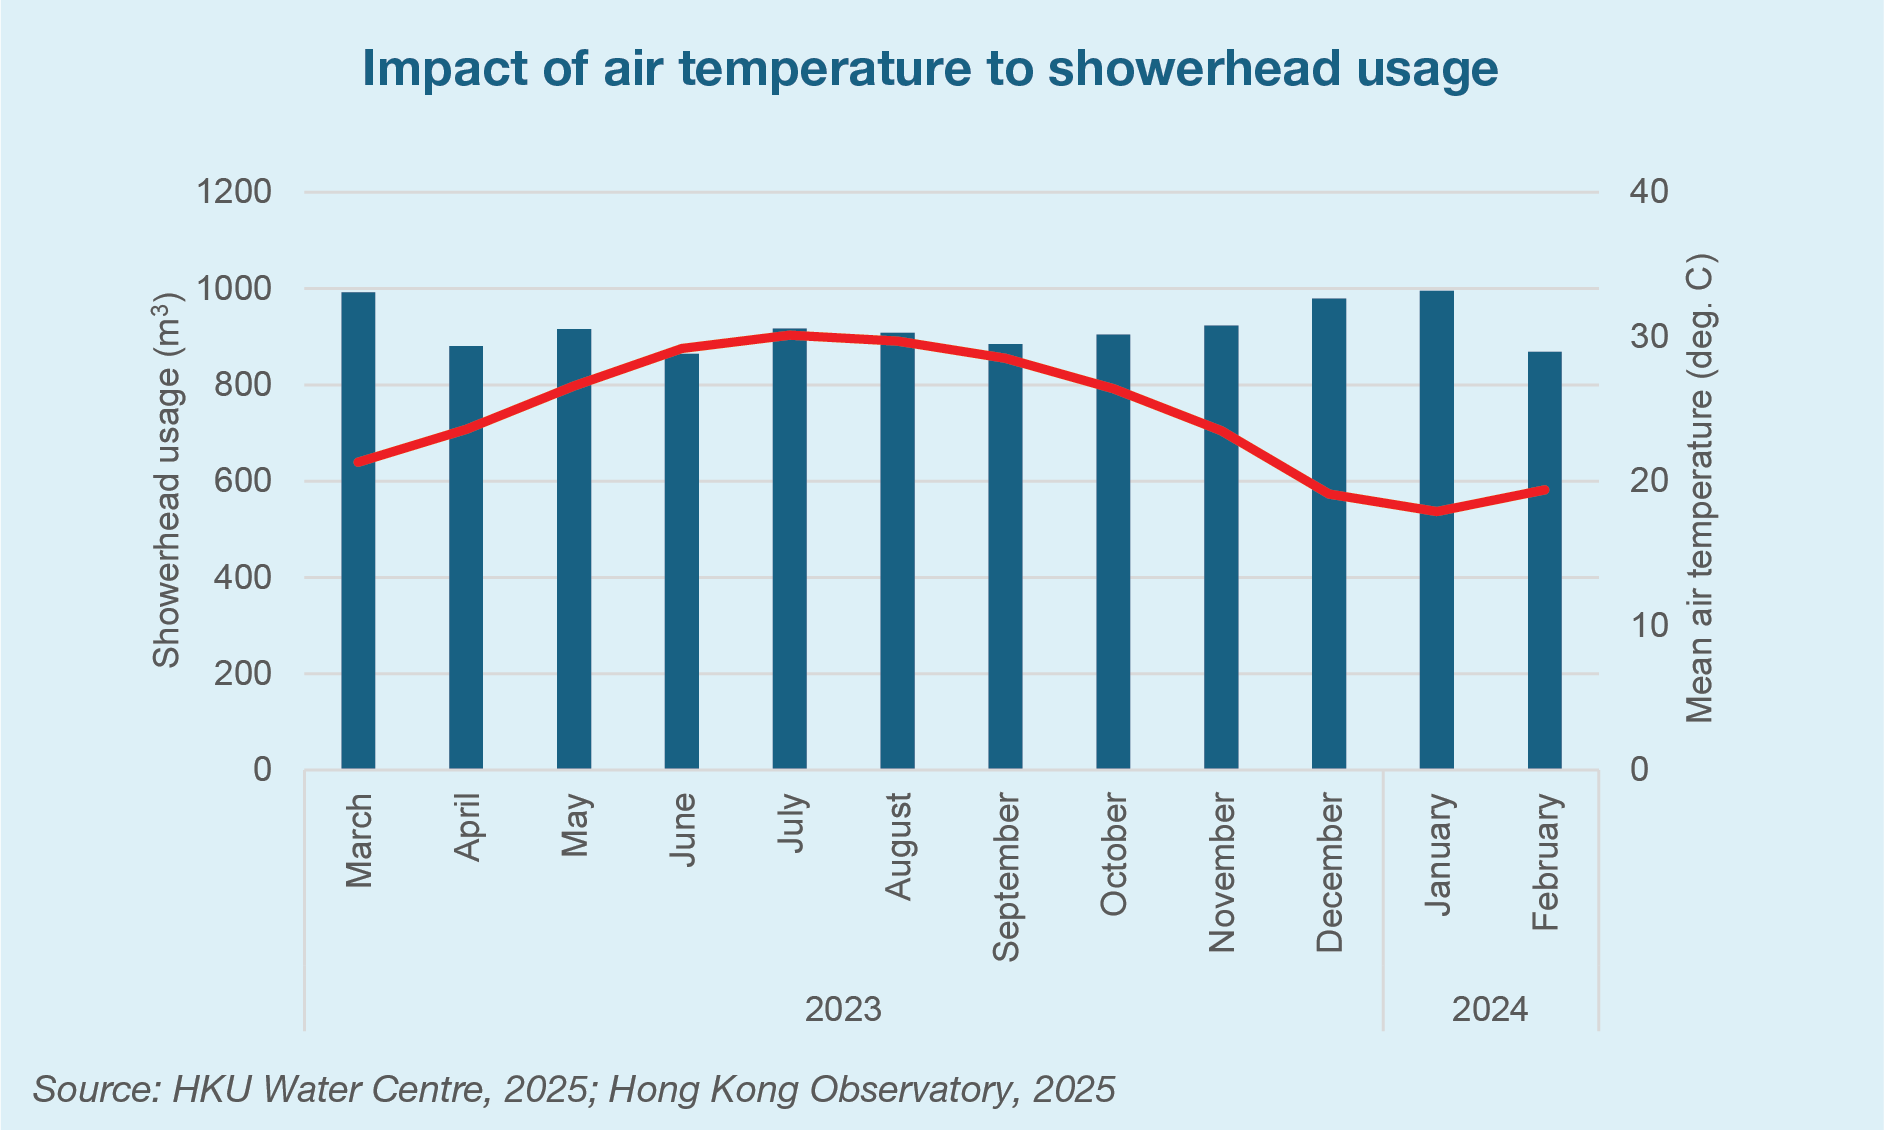
1.7 How would the weather affect people’s showering habits?
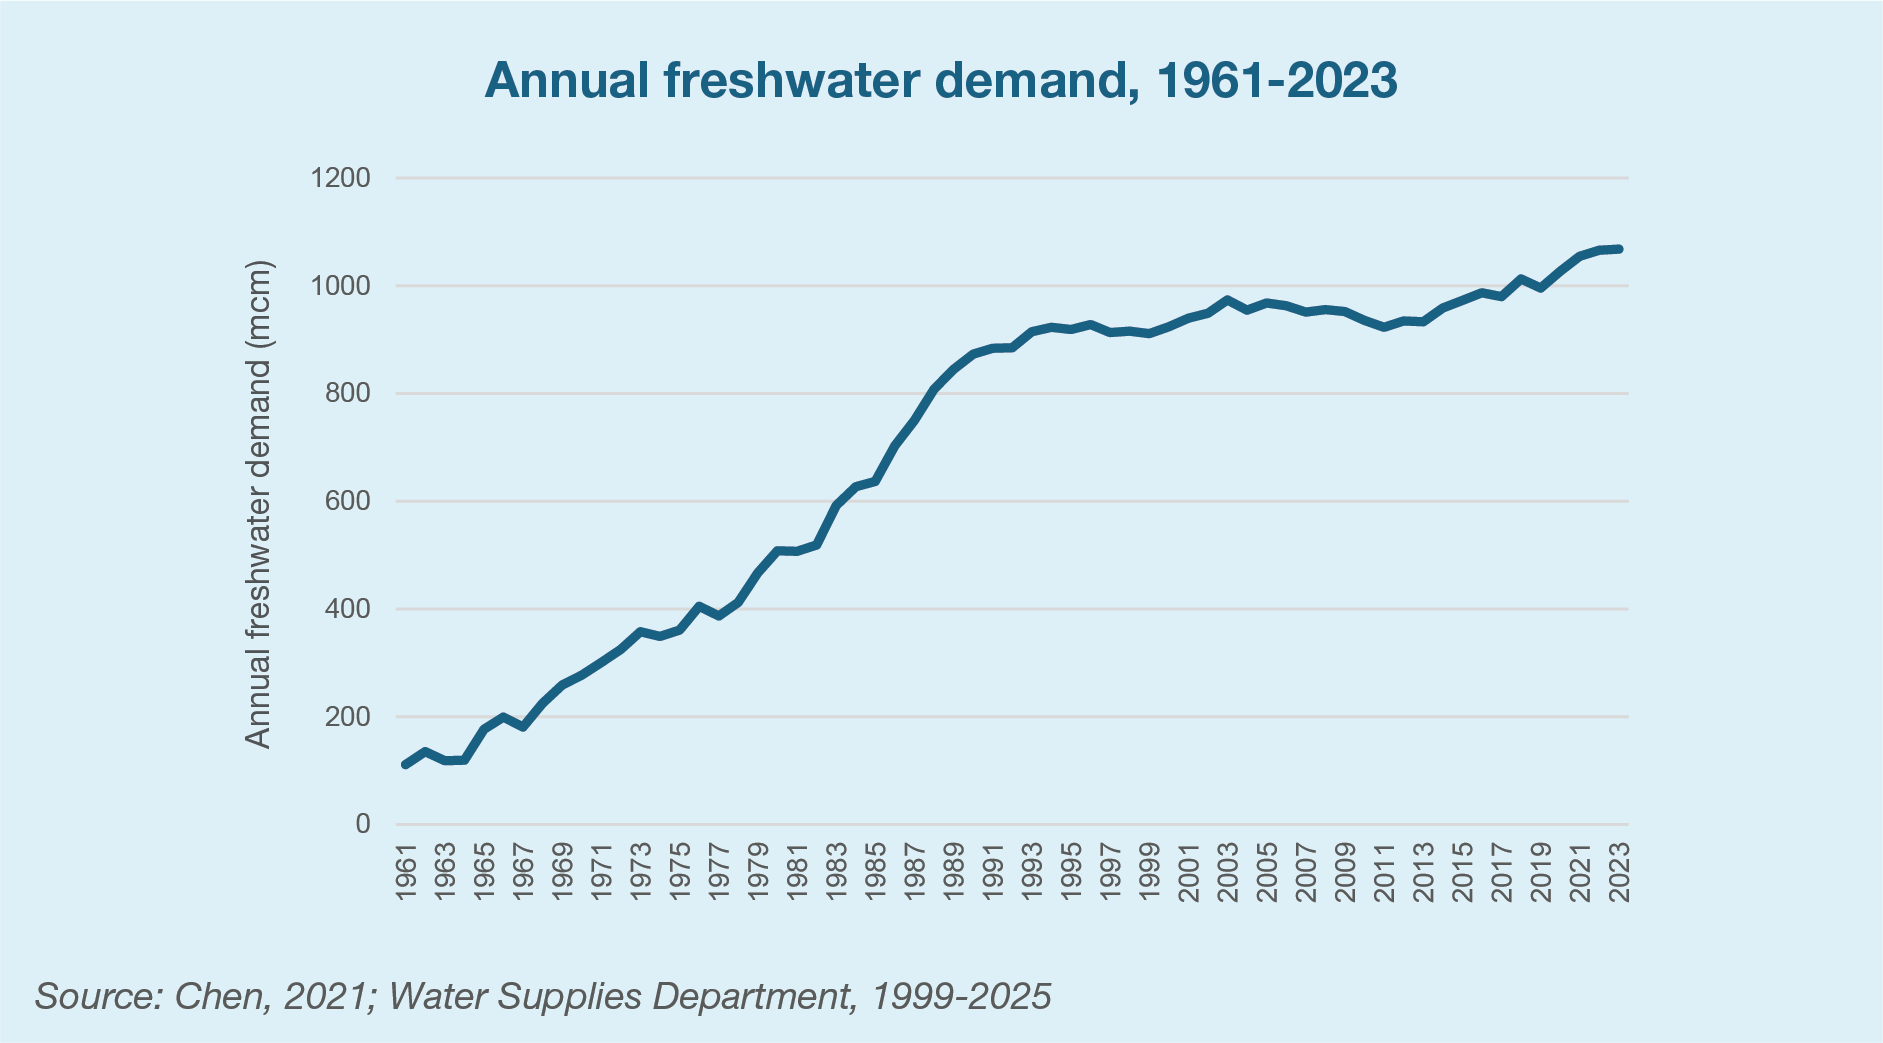
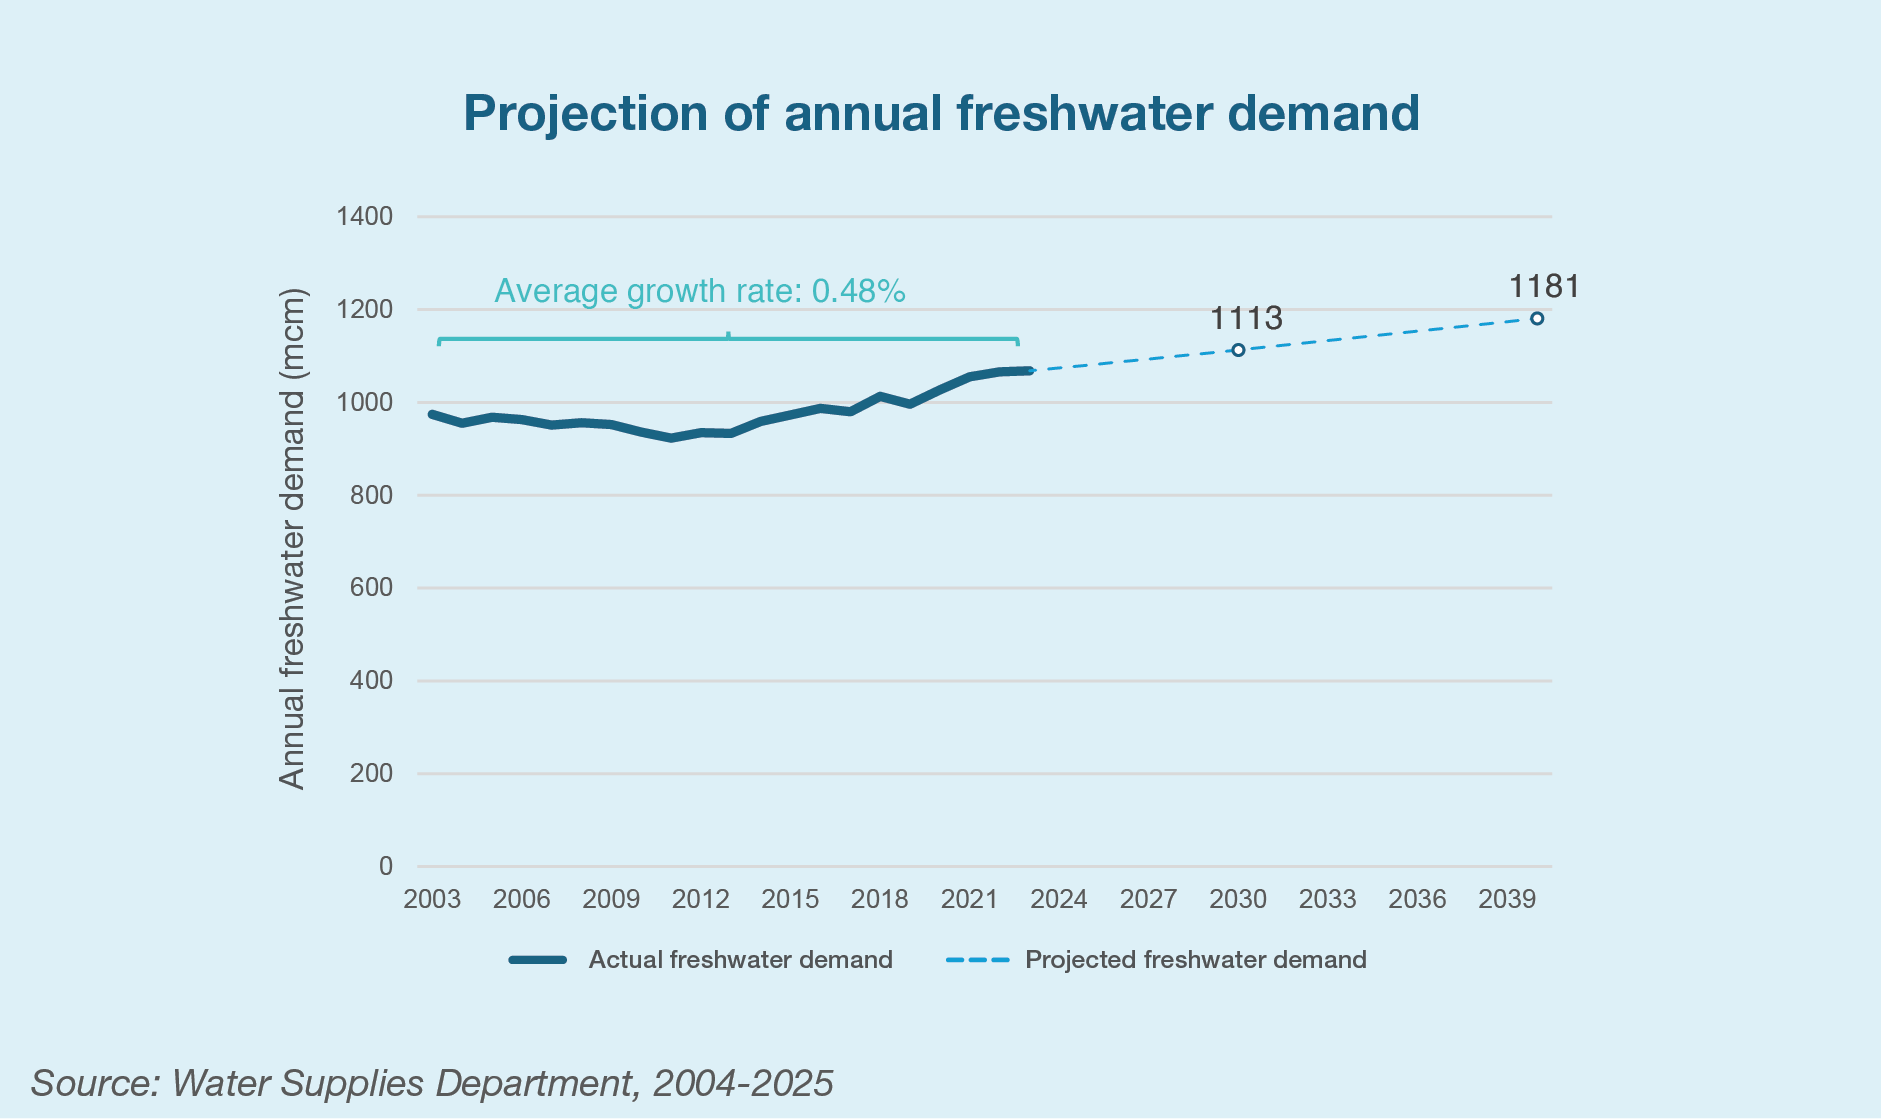
2.3 What is the current freshwater demand in Hong Kong?
2.4 What is the forecast of future annual freshwater demand for Hong Kong?
2.6 What is Hong Kong’s water conservation target?
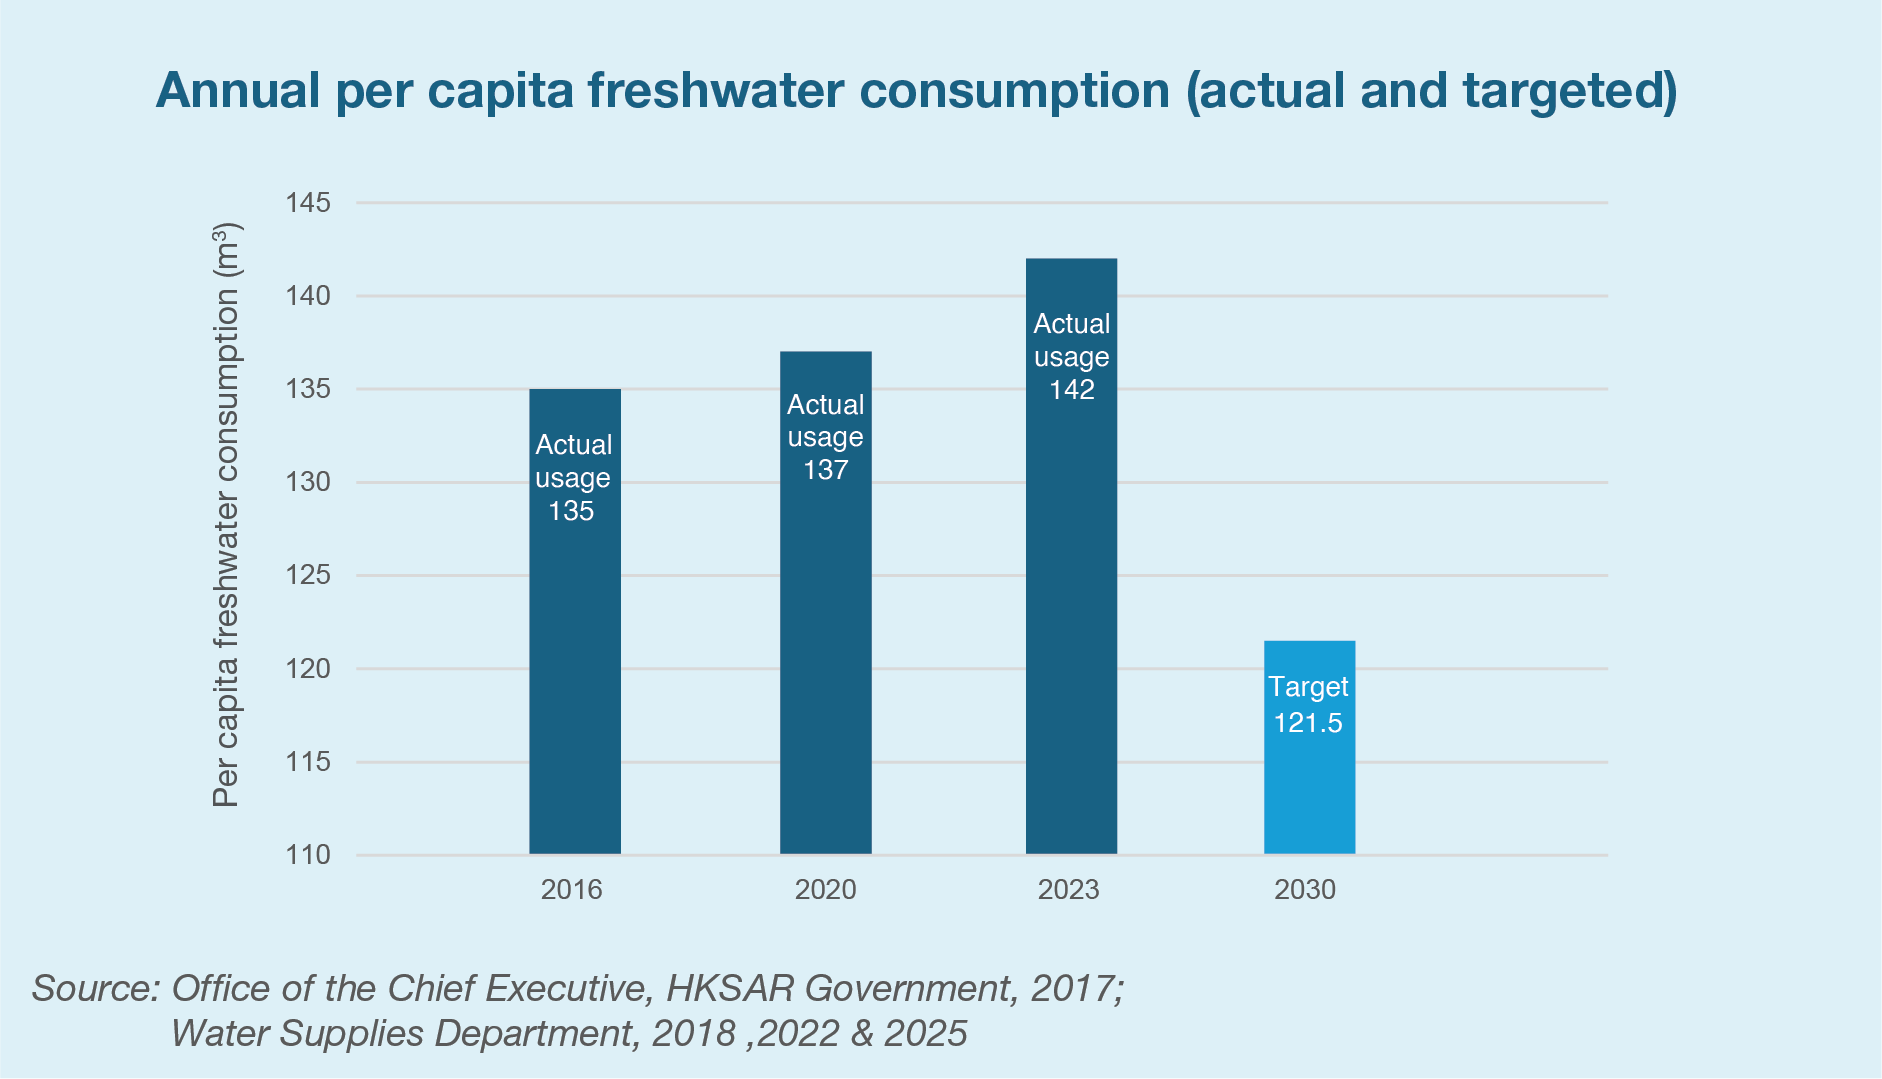
2.7 To what extent has Hong Kong made progress in implementing its water conservation efforts?
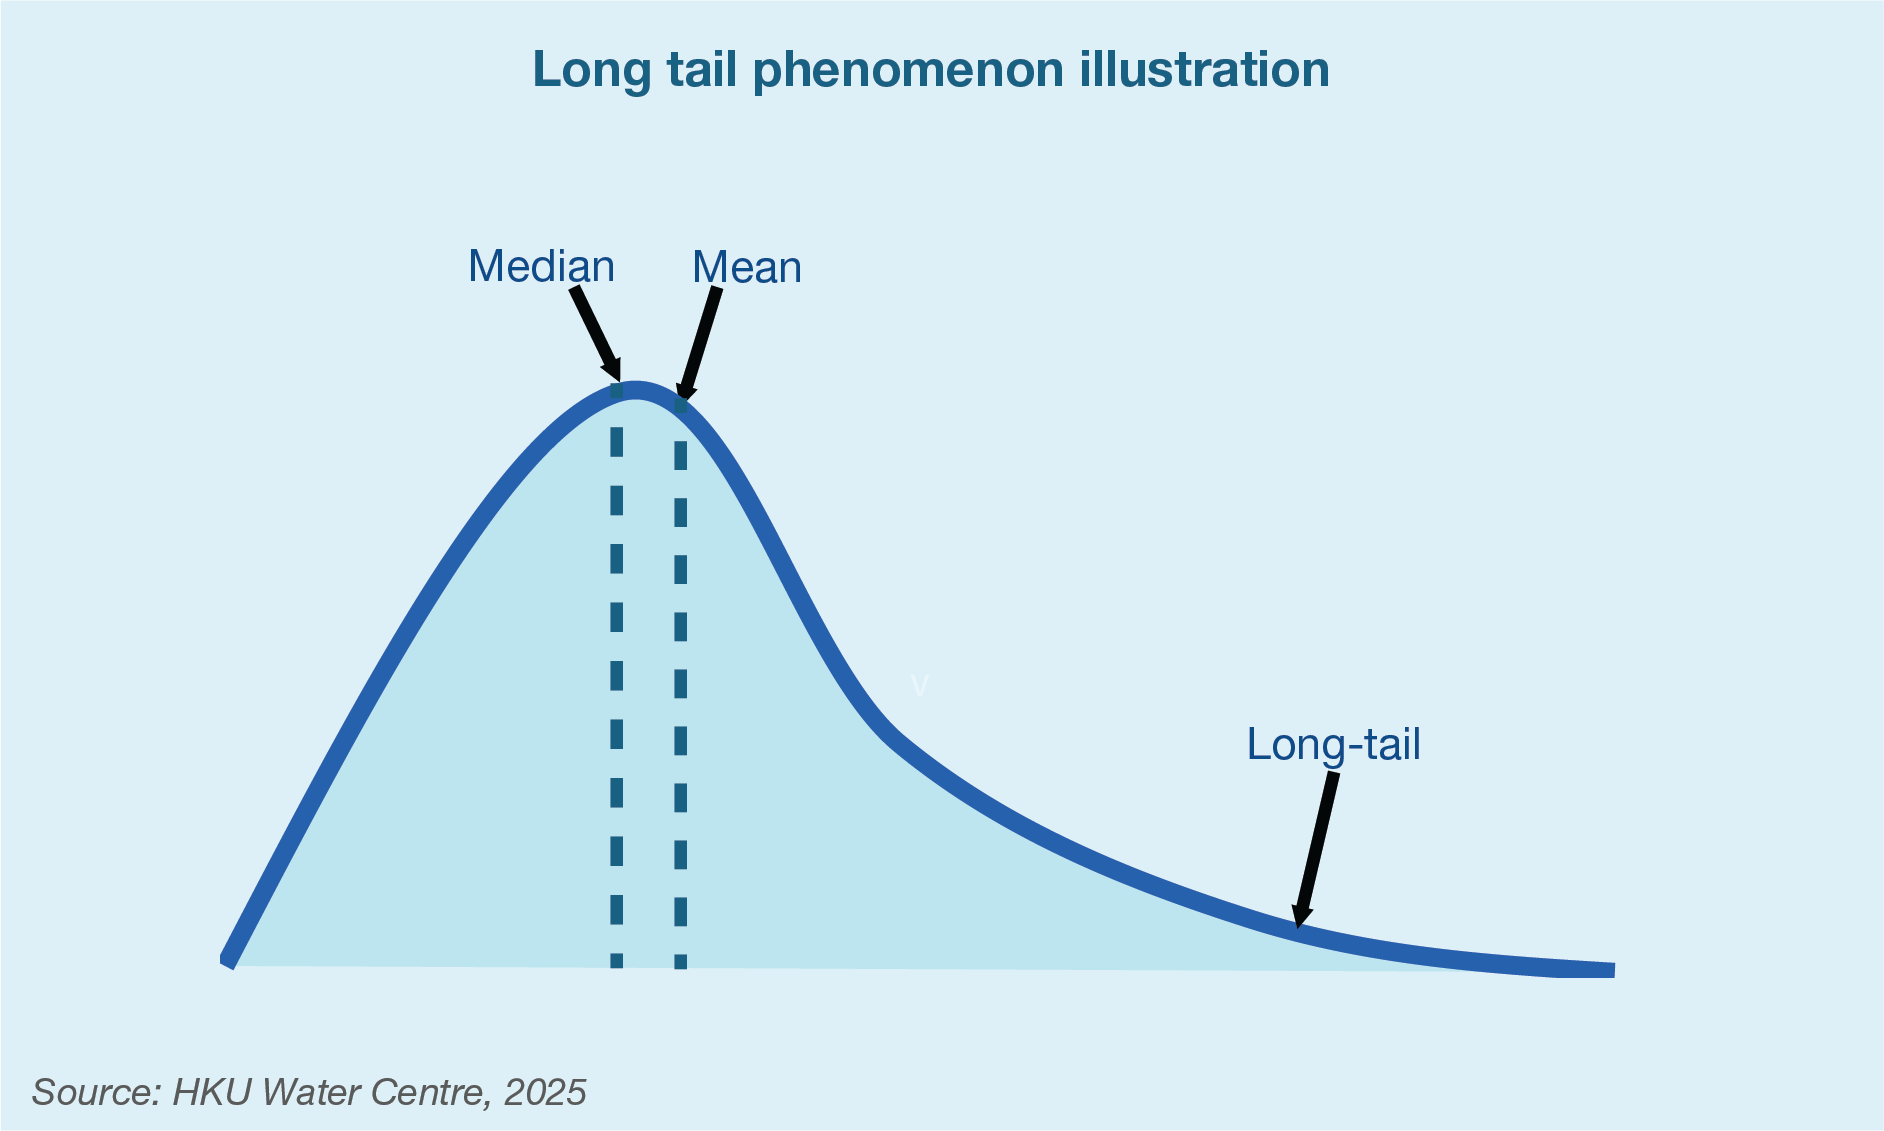
2.9 Does water consumption in Hong Kong follow a long tail distribution?
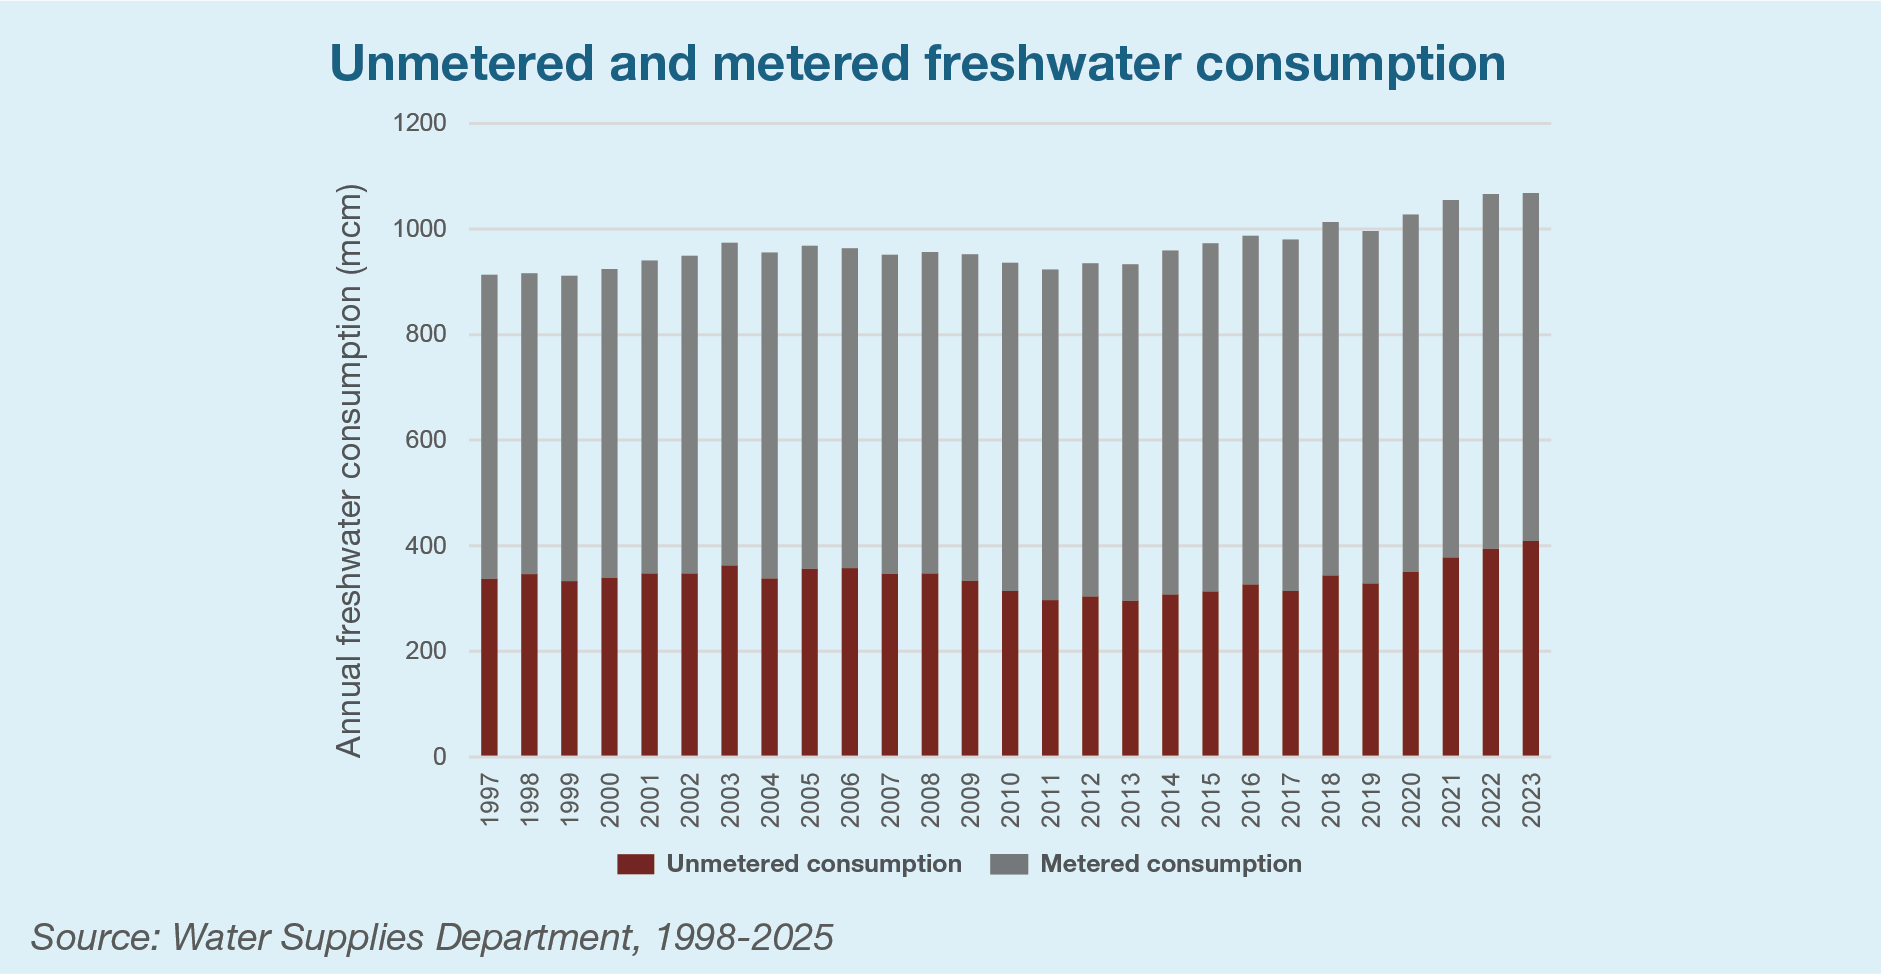
2.12 What proportion of Hong Kong’s water consumption is unmetered?
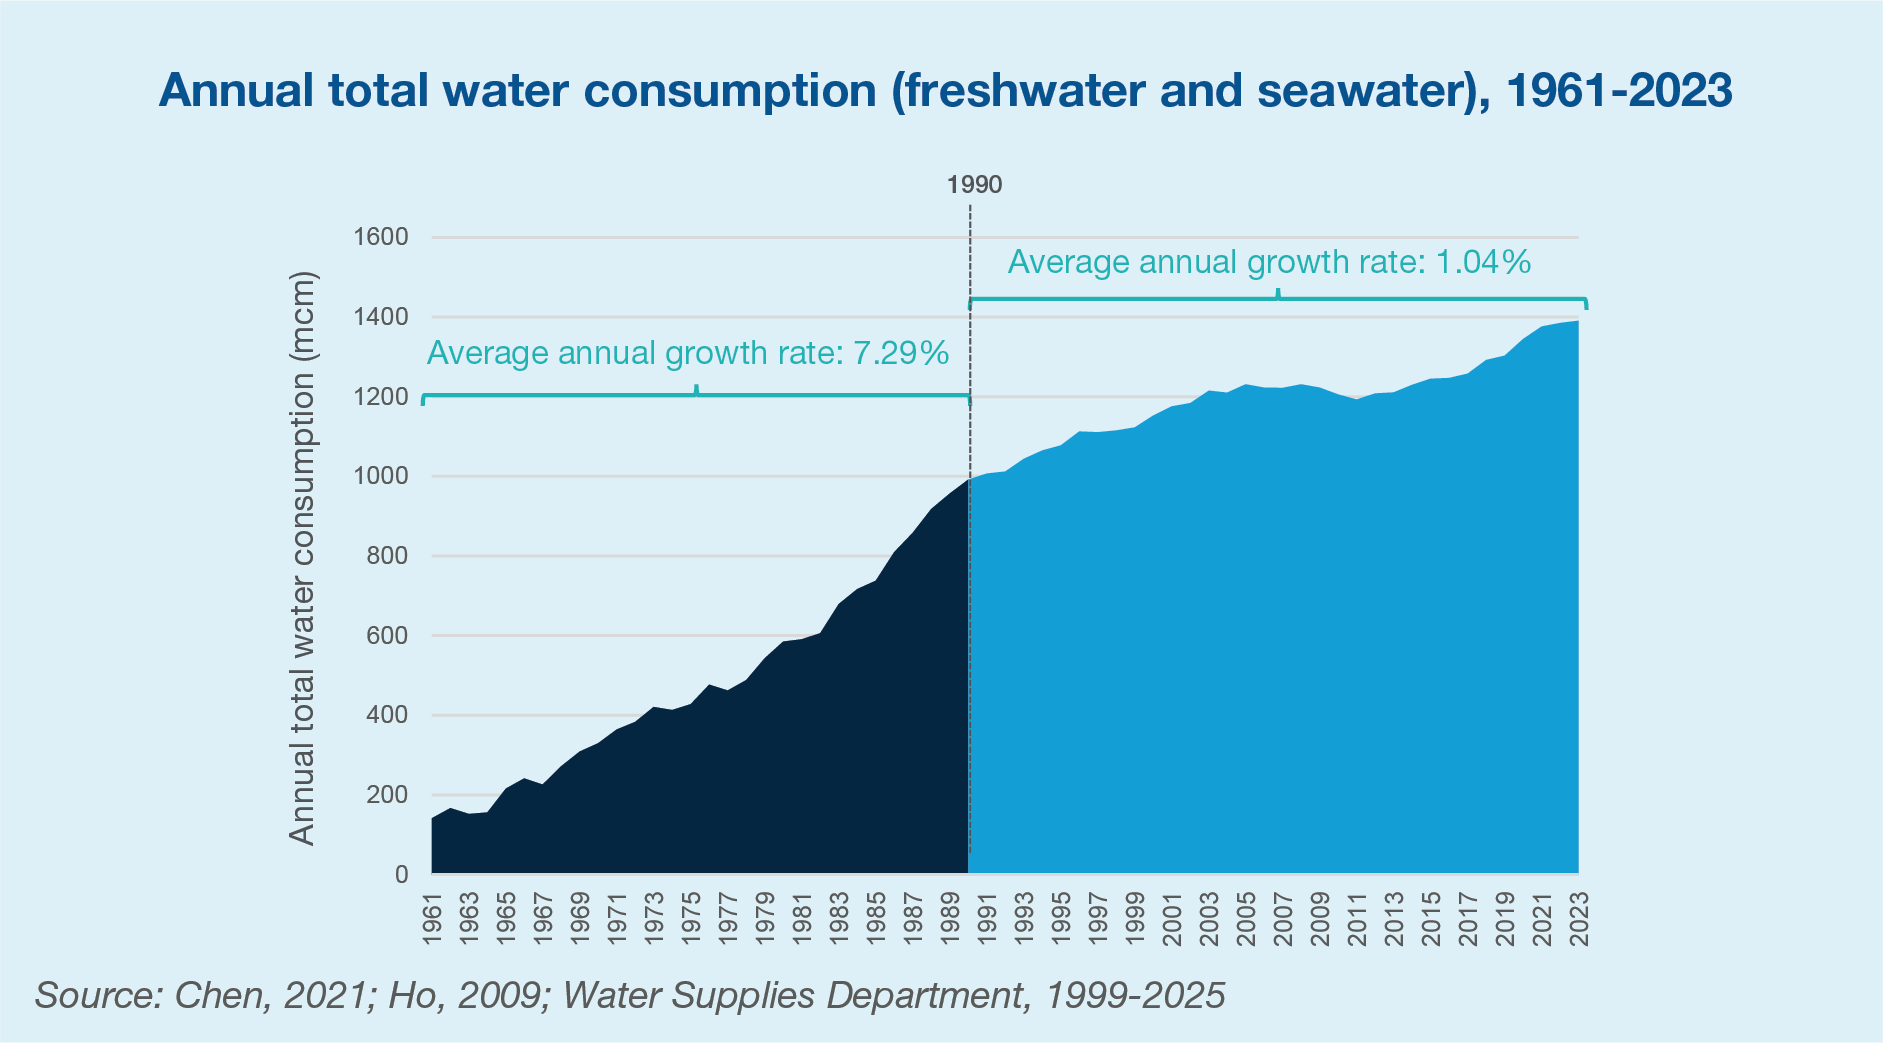
3.1 In what ways has Hong Kong’s total water consumption trajectory changed over the years?
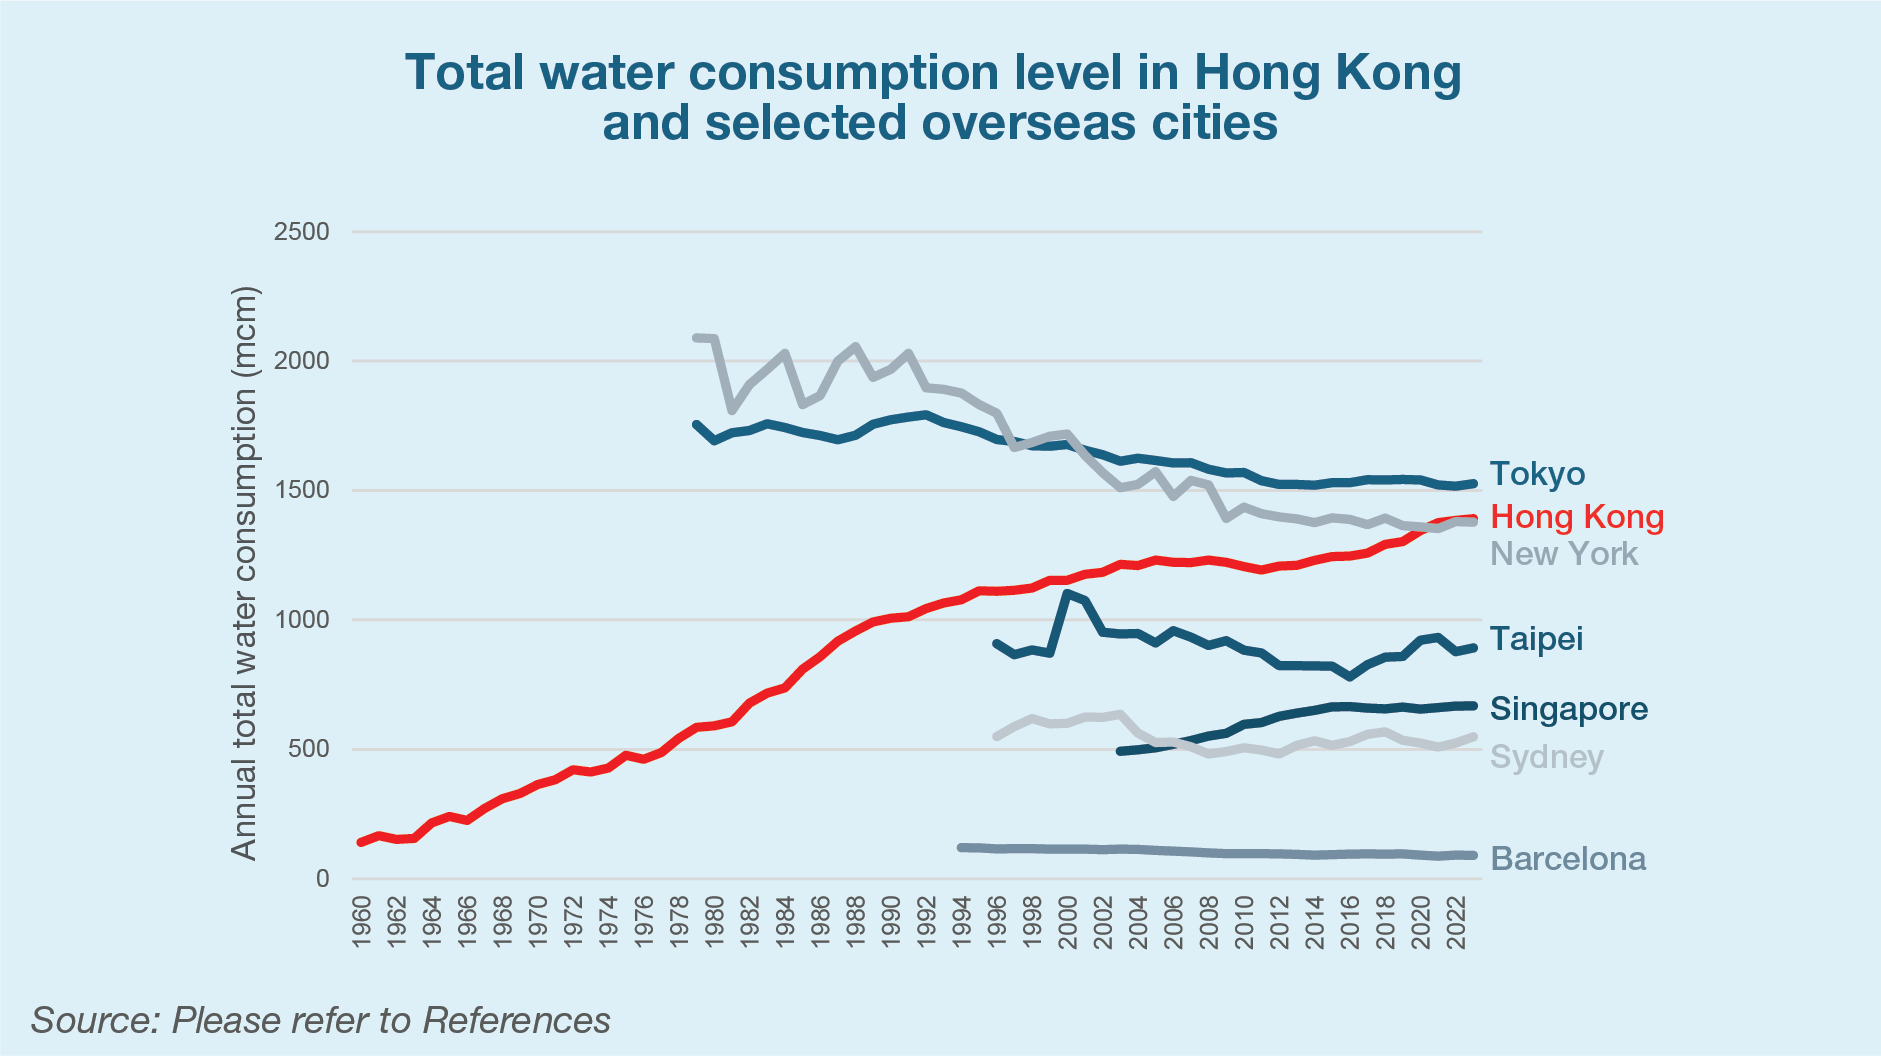
3.4 How does Hong Kong’s water consumption trend compare to those of overseas cities?
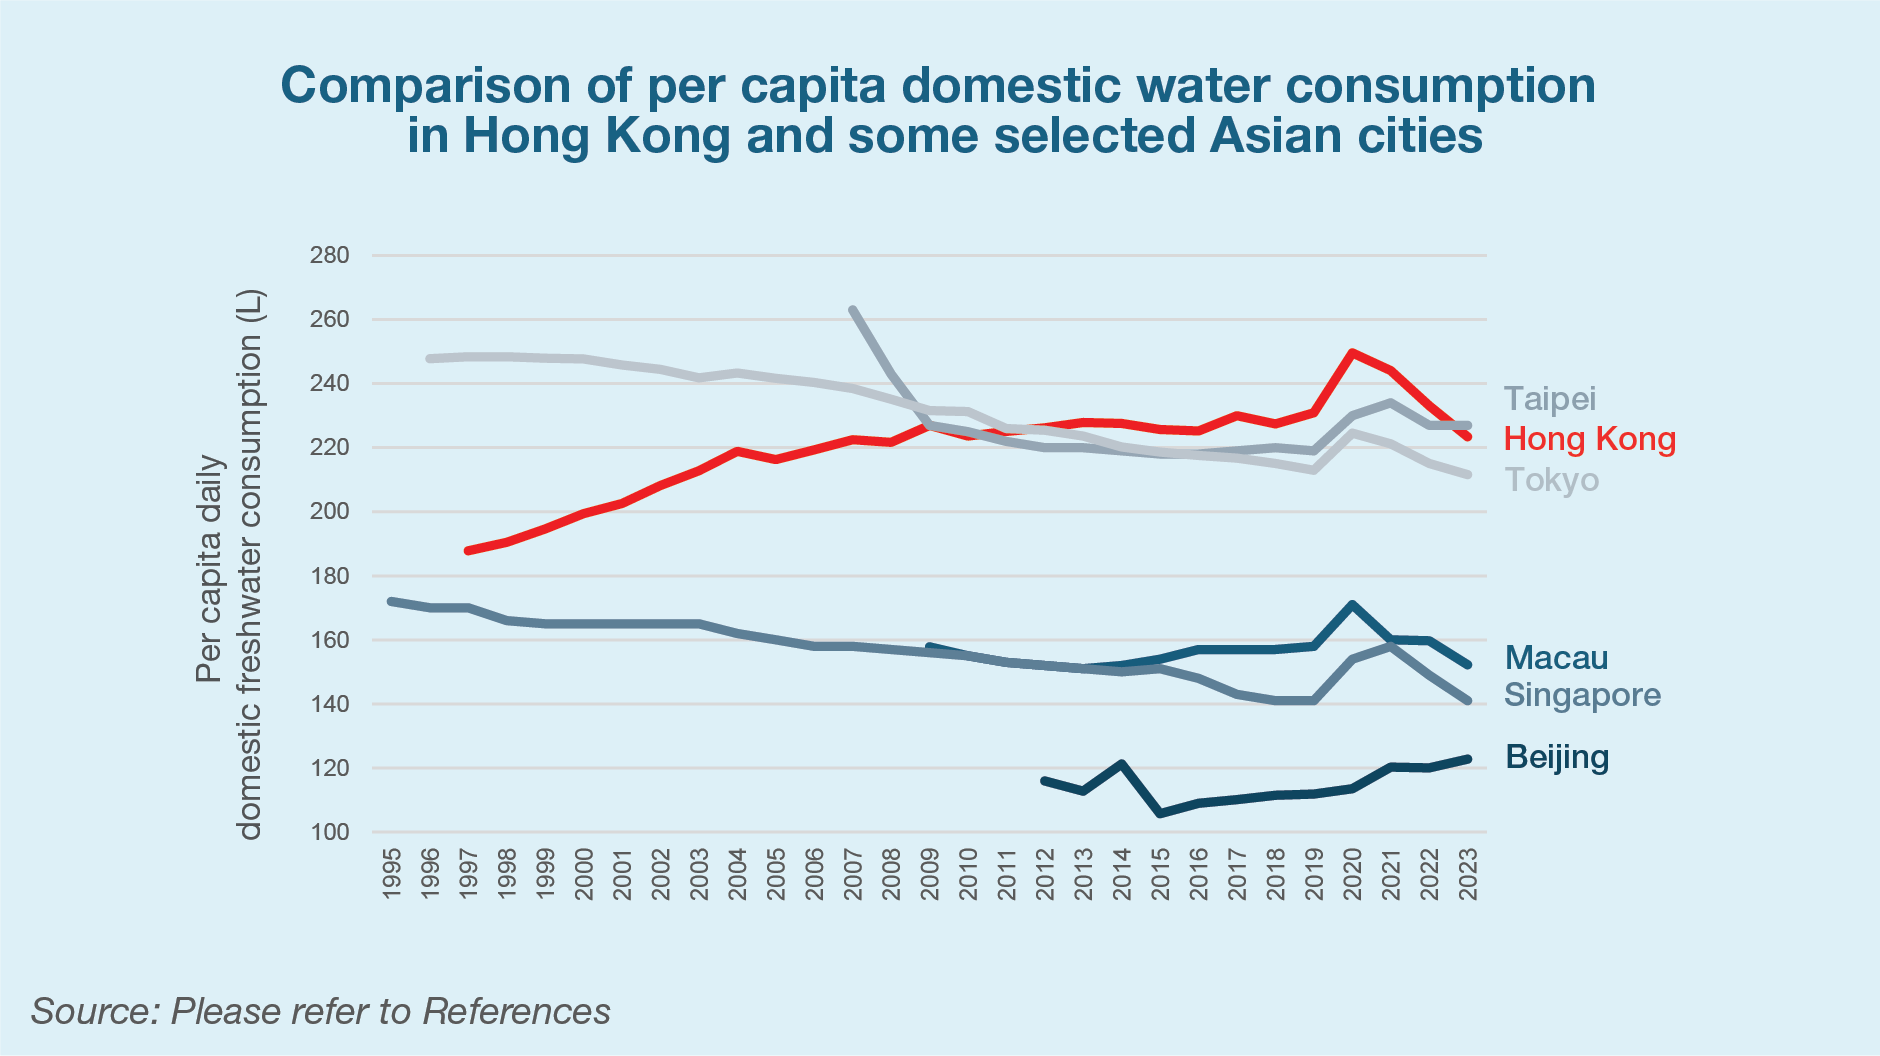
3.5 How does Hong Kong’s domestic water consumption level compare to those of overseas cities?
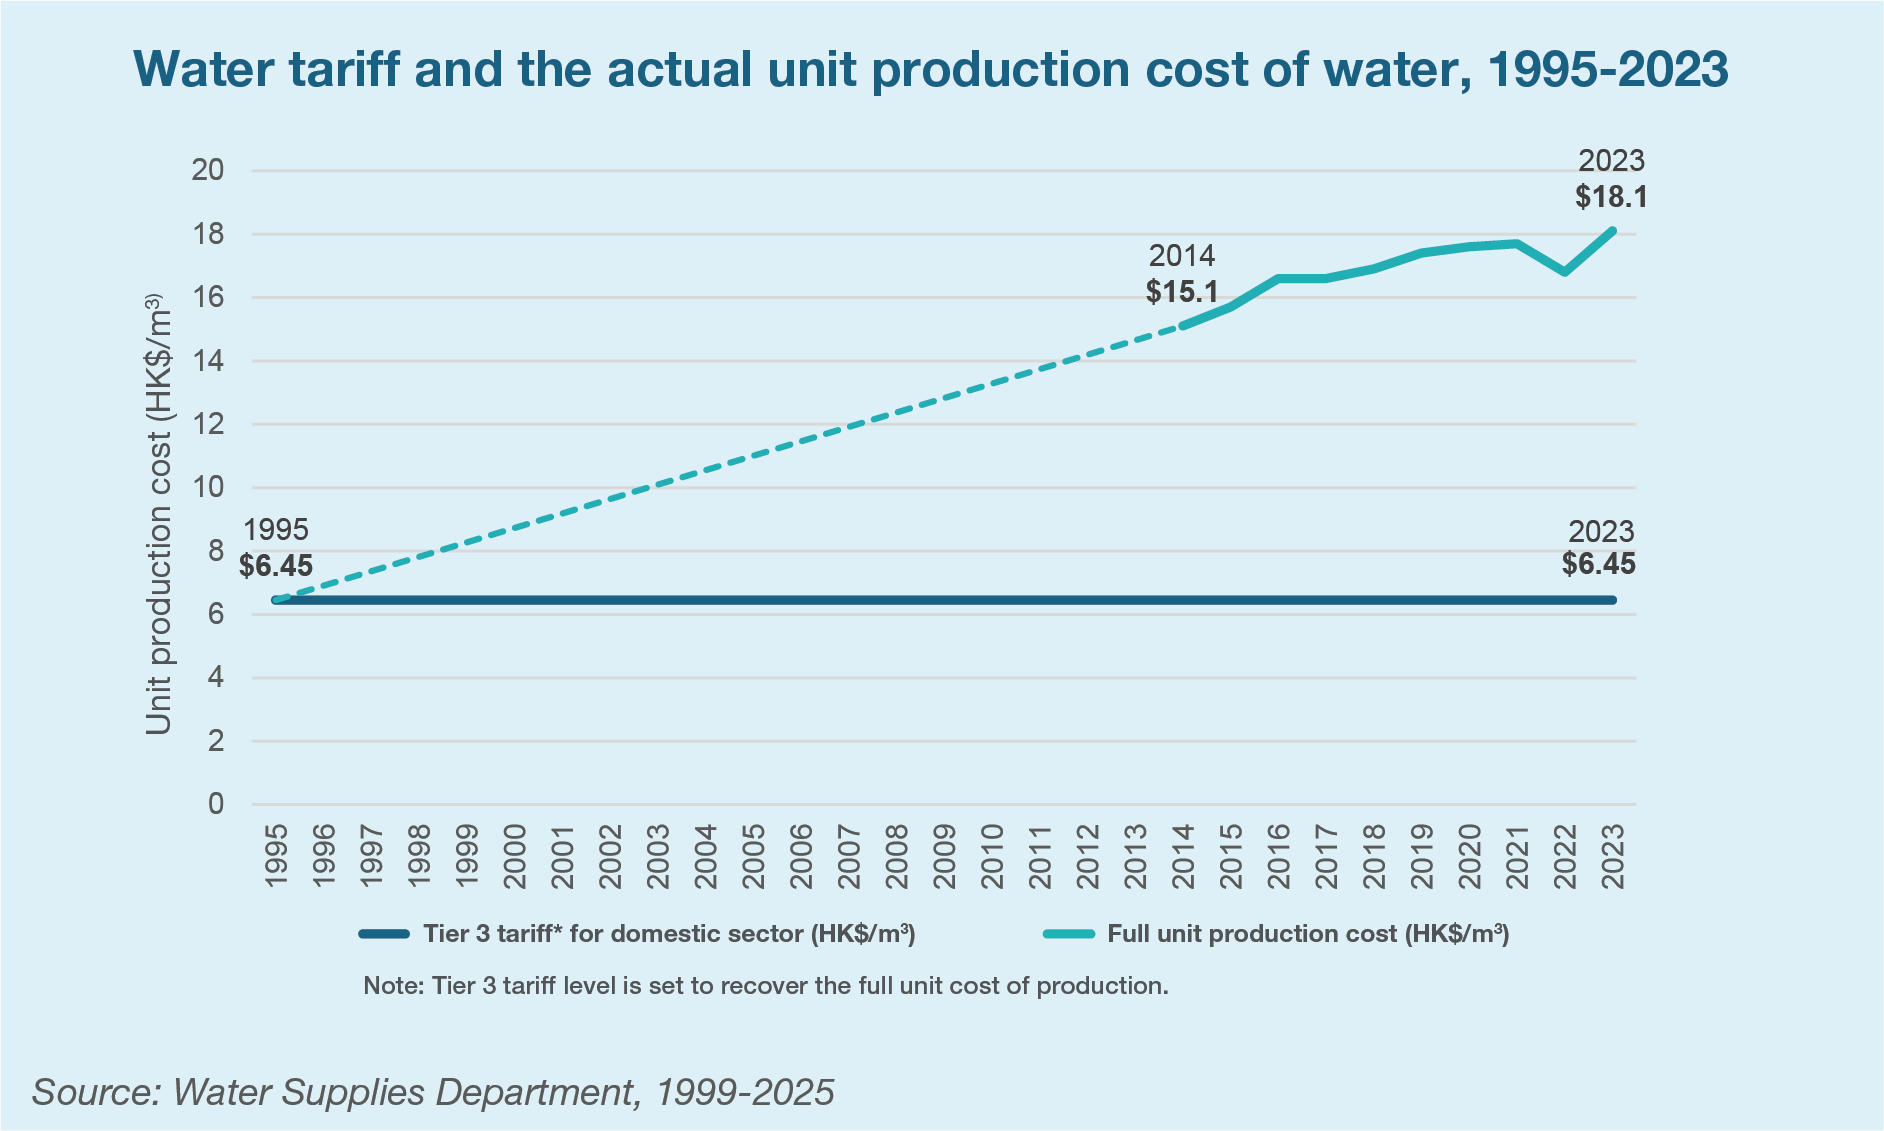
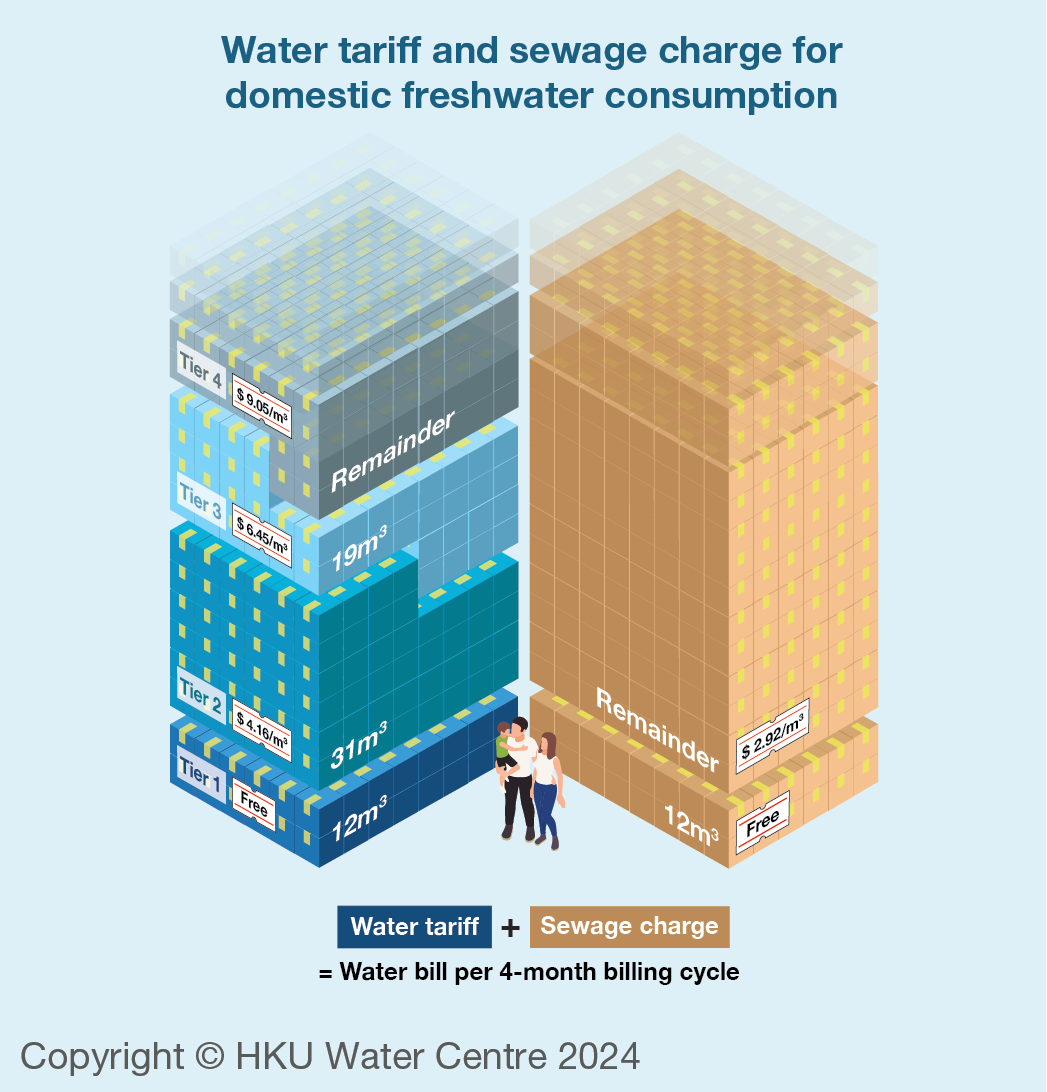
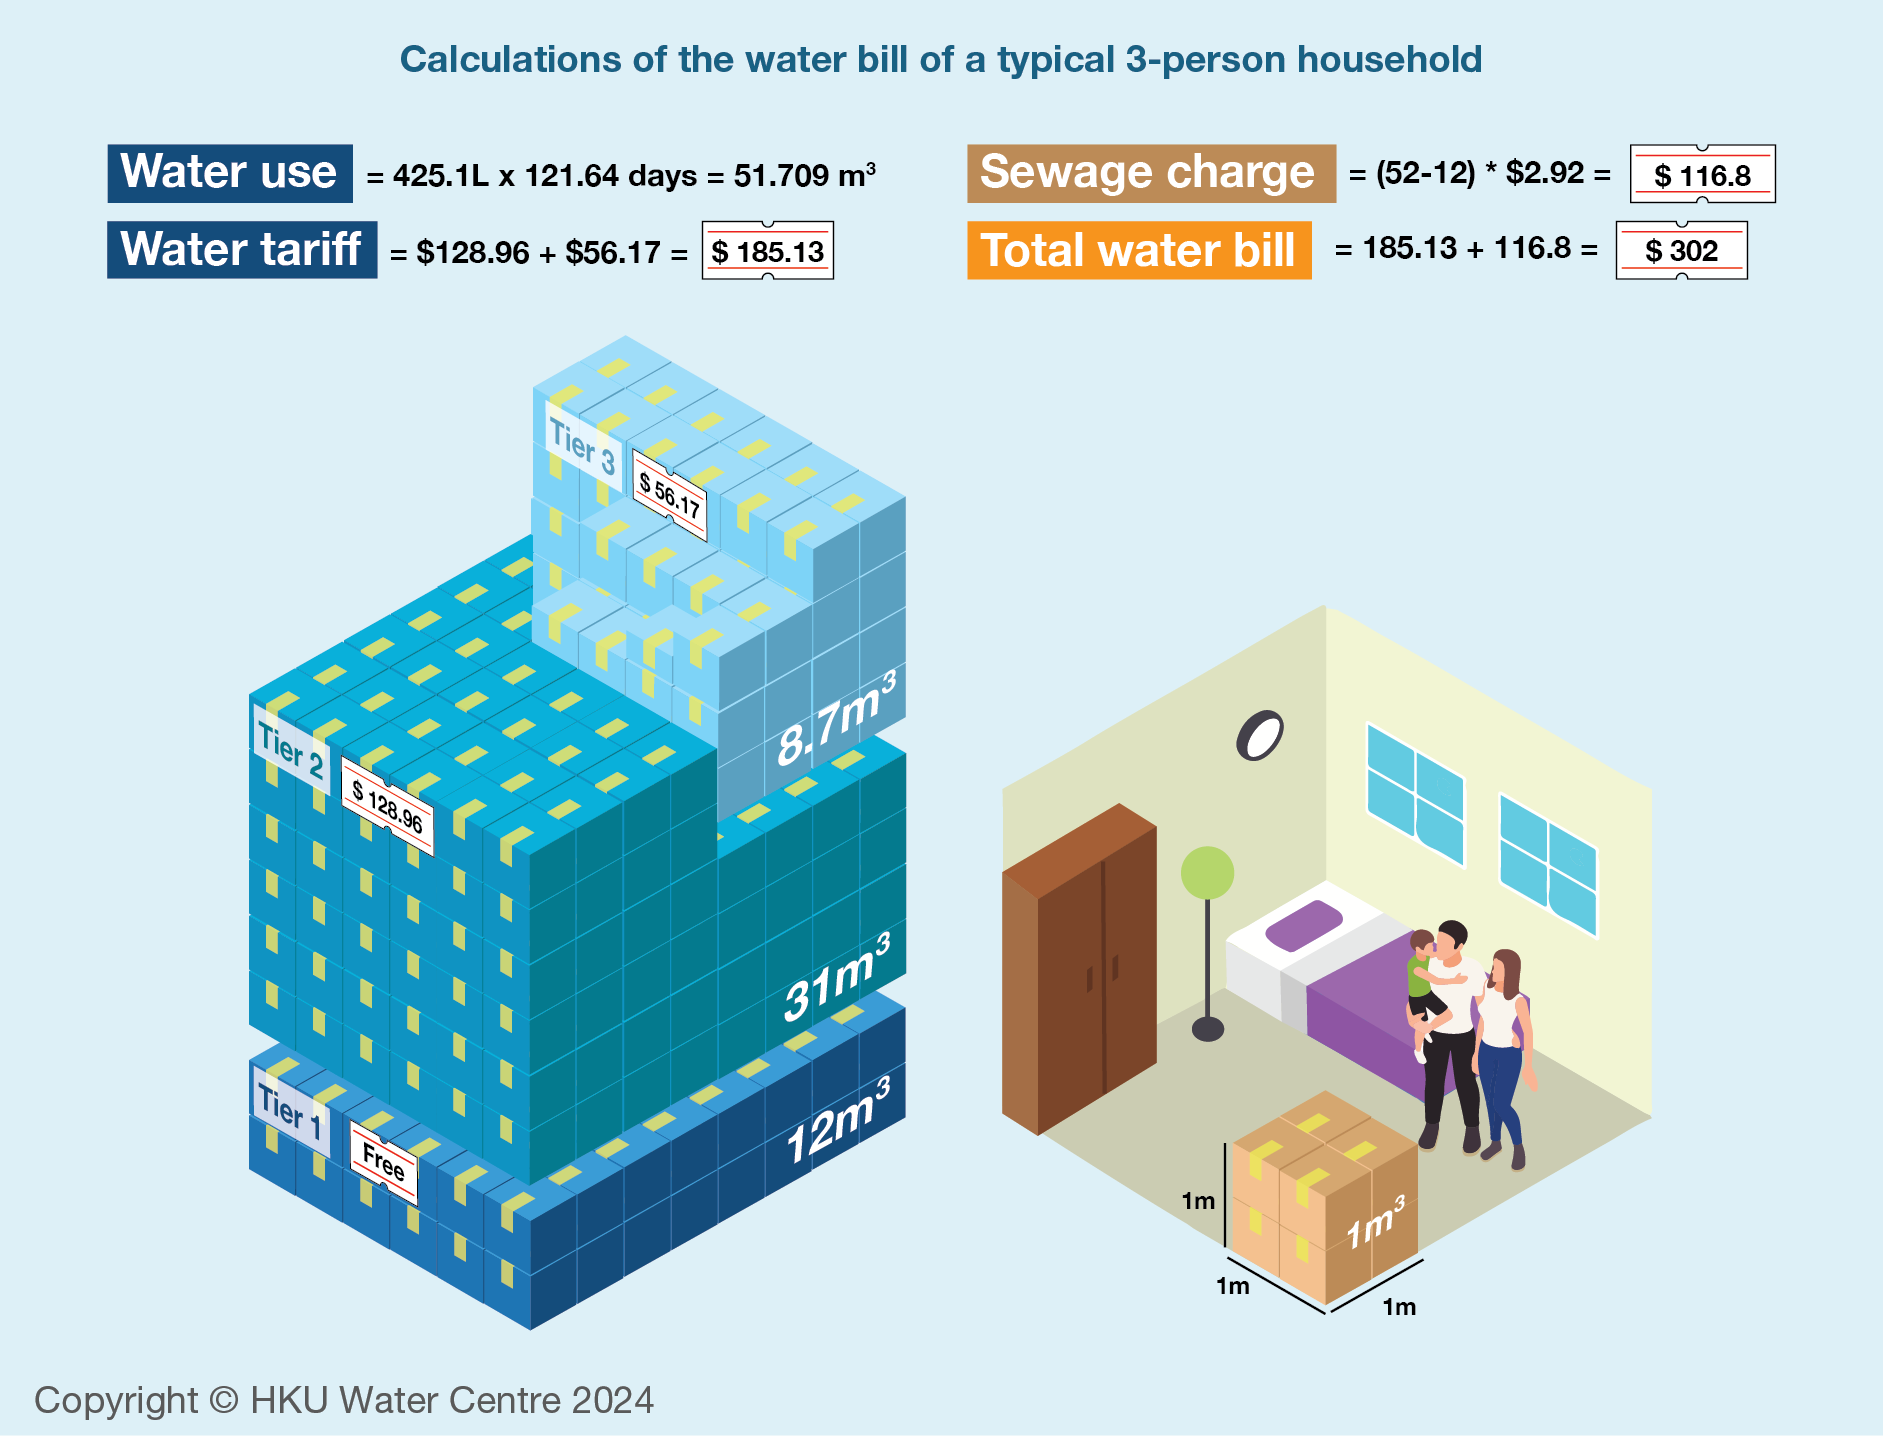
3.6 How much does residential water usage cost?
3.7 What is the dollar amount of a typical water bill for an average family?
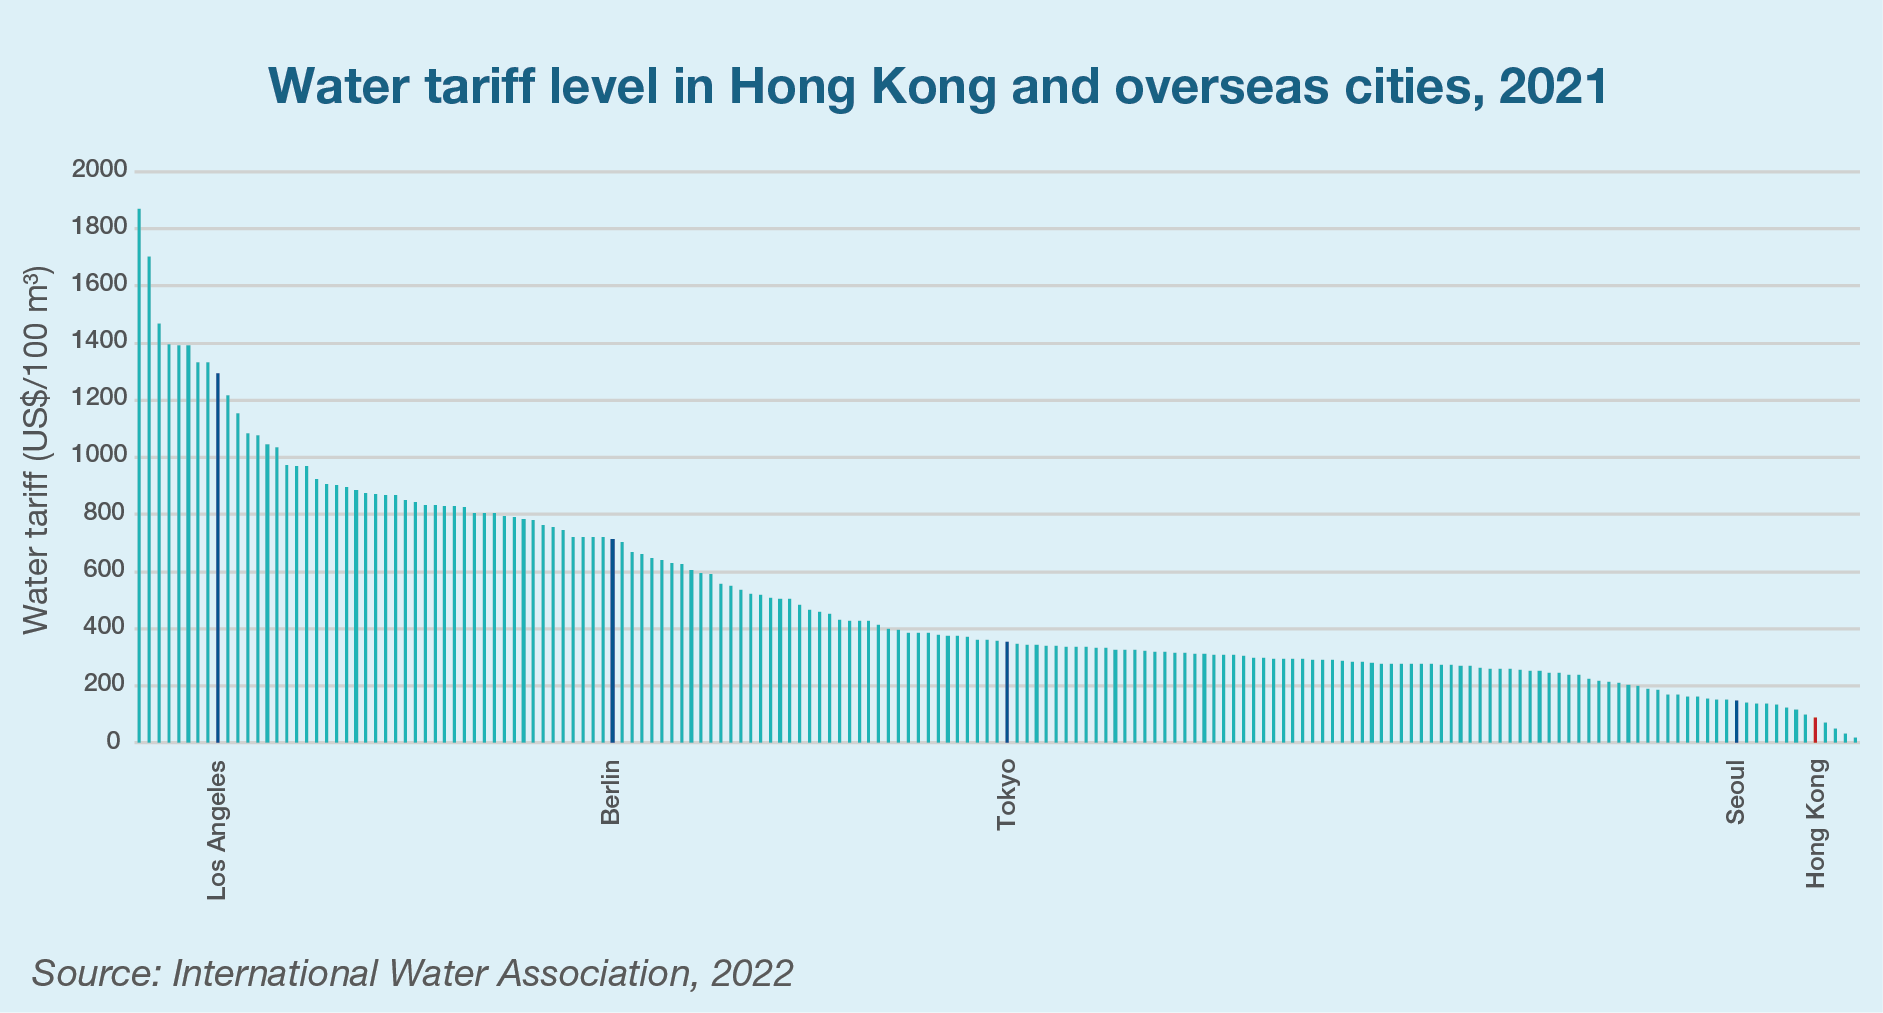
3.10 How does Hong Kong’s water tariff level compare to those of overseas cities?
3.11 Why is tap water so cheap in Hong Kong?